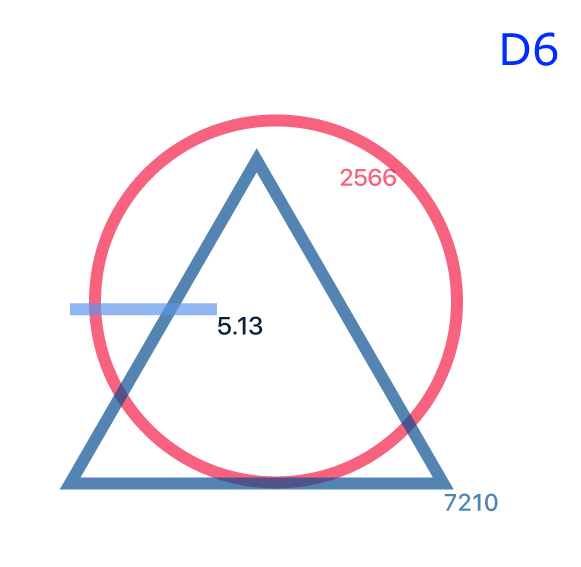
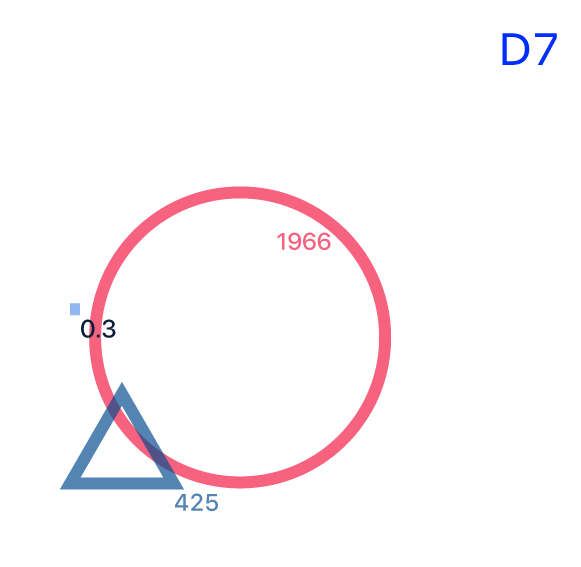
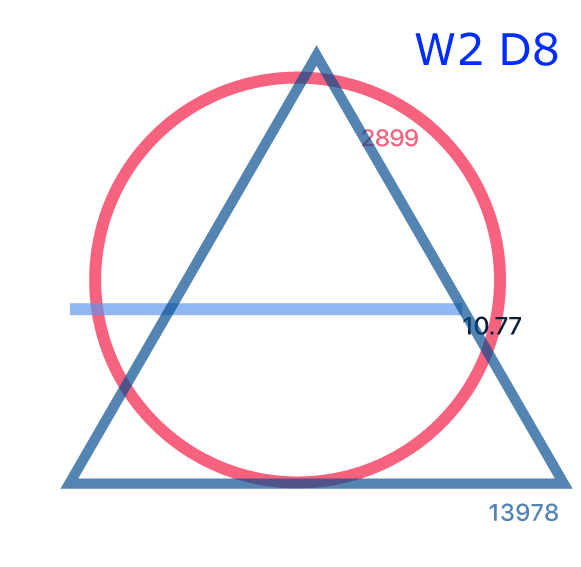
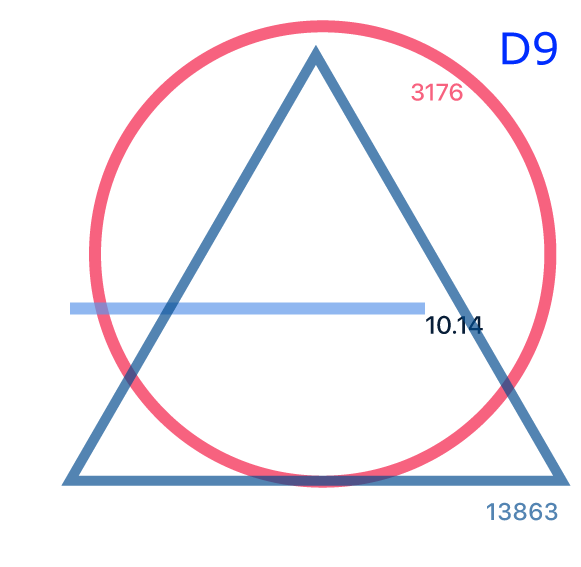
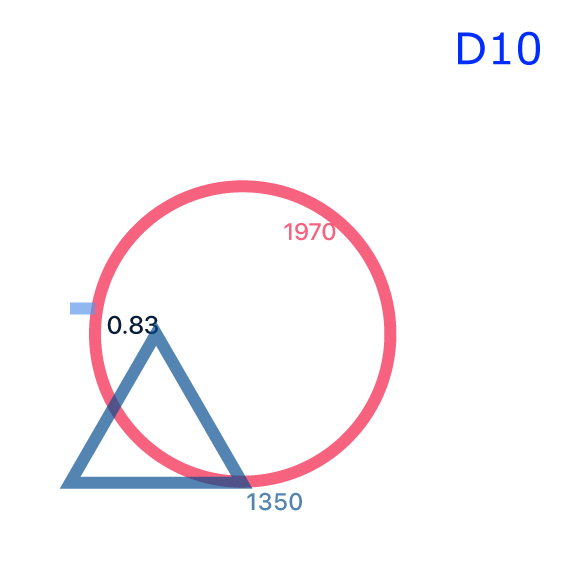
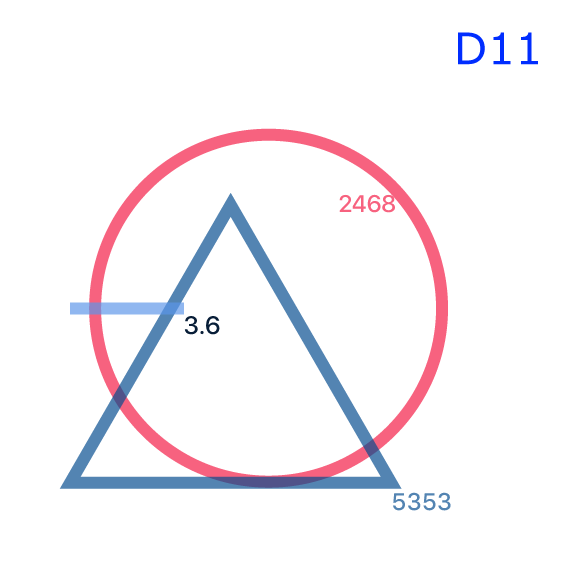
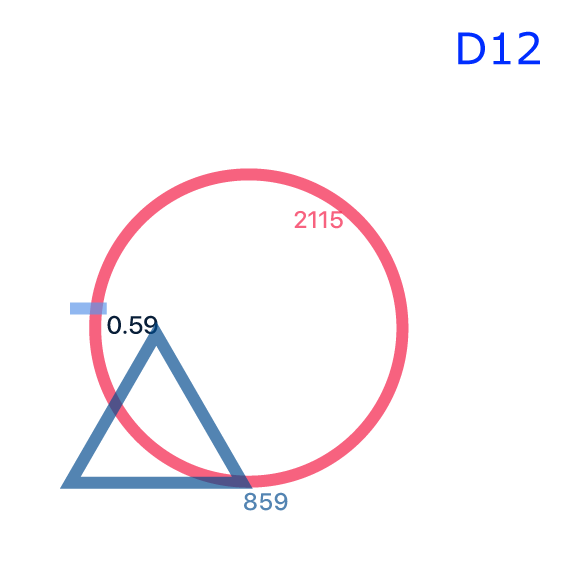
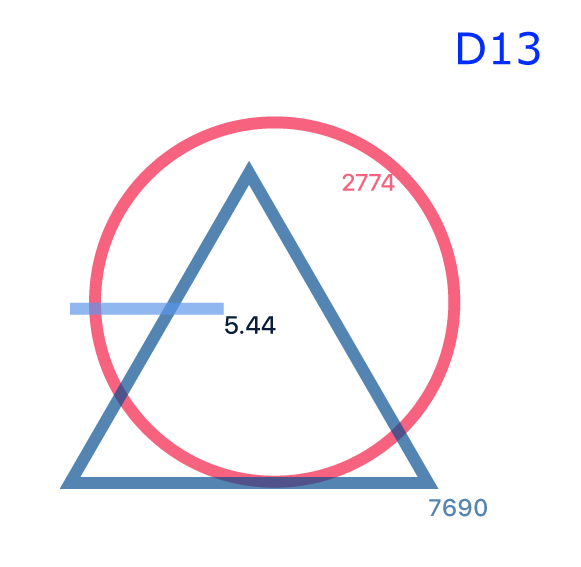
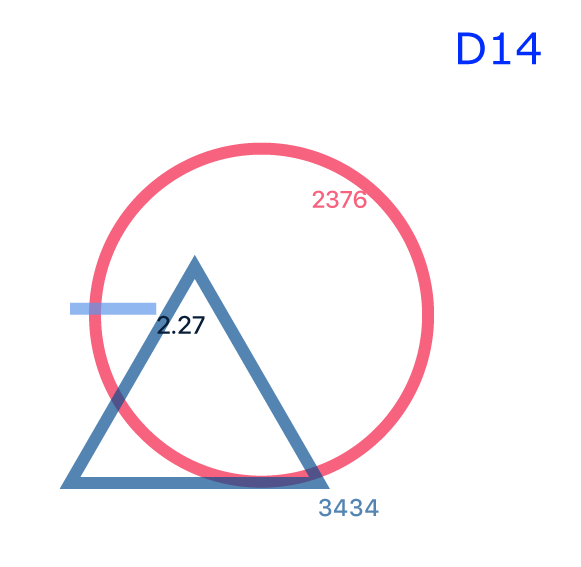
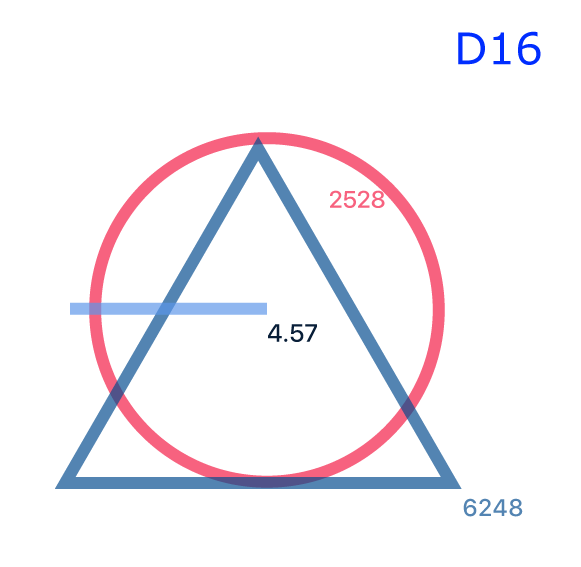
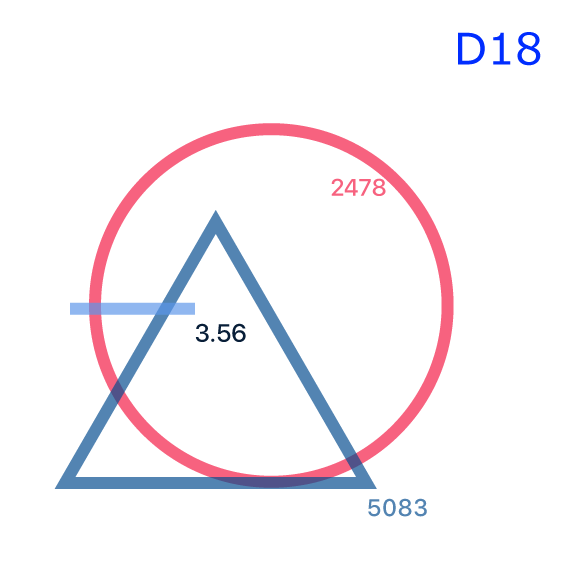
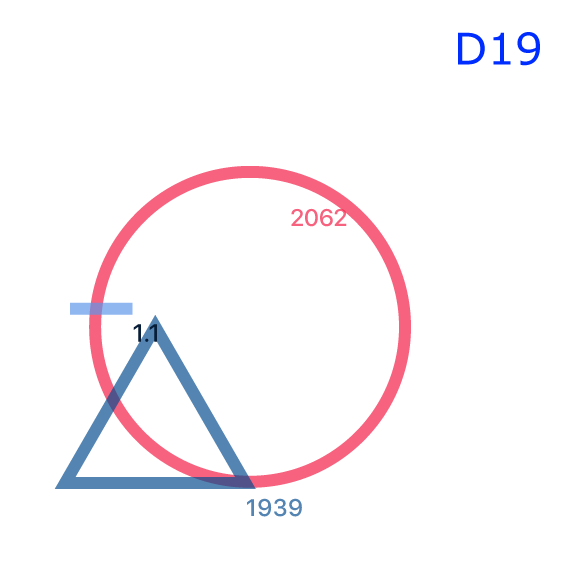
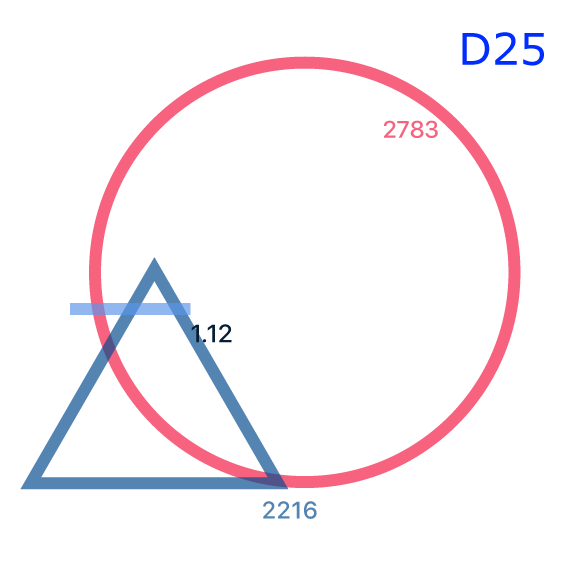
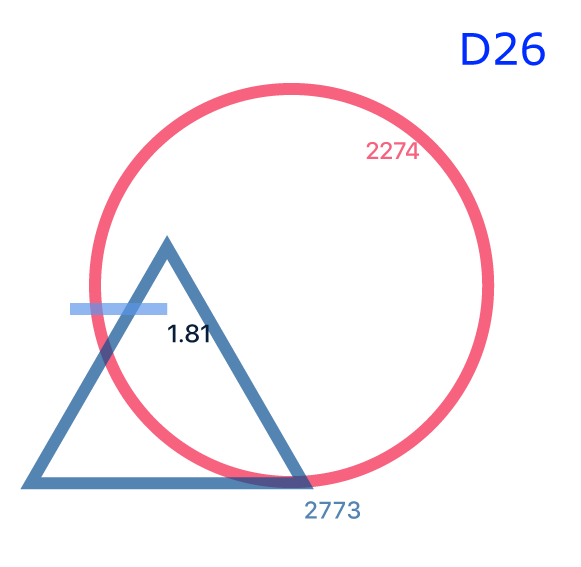
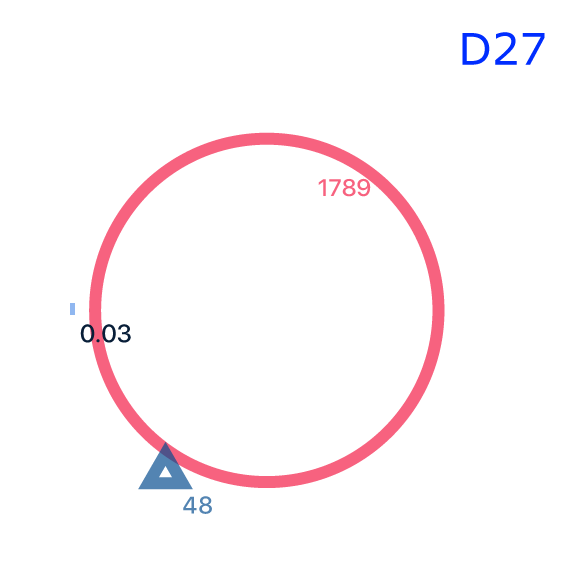
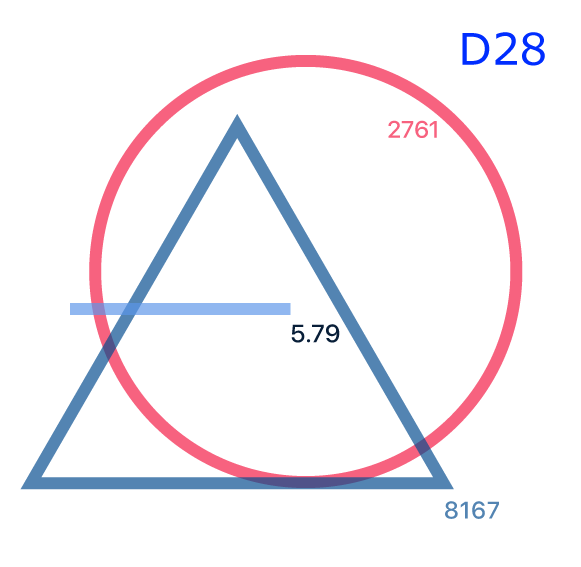
I recorded the number of steps taken daily, distance travelled and the calories I burned. For each of the 28 days, I produced a graphic to visualise this data.